CO2 pressure temperature phase visualization using geometry node
__EDIT (2026-05-08) DISCLAIMER : !!! DO NOT USE WHATEVER YOU SEE HERE IN REAL LIFE SITUATION. THE NUMBERS ARE OFF BY LIKE 10 TIMES.__ I don't plan to debug it very soon.
Context: I was trying to make sure gas system in my airsoft^[[email protected]] gun will not destroy itself or shoot metal projectile in my face due to mechanical failure.
I make this so I can see all the parameters I need in one glance.
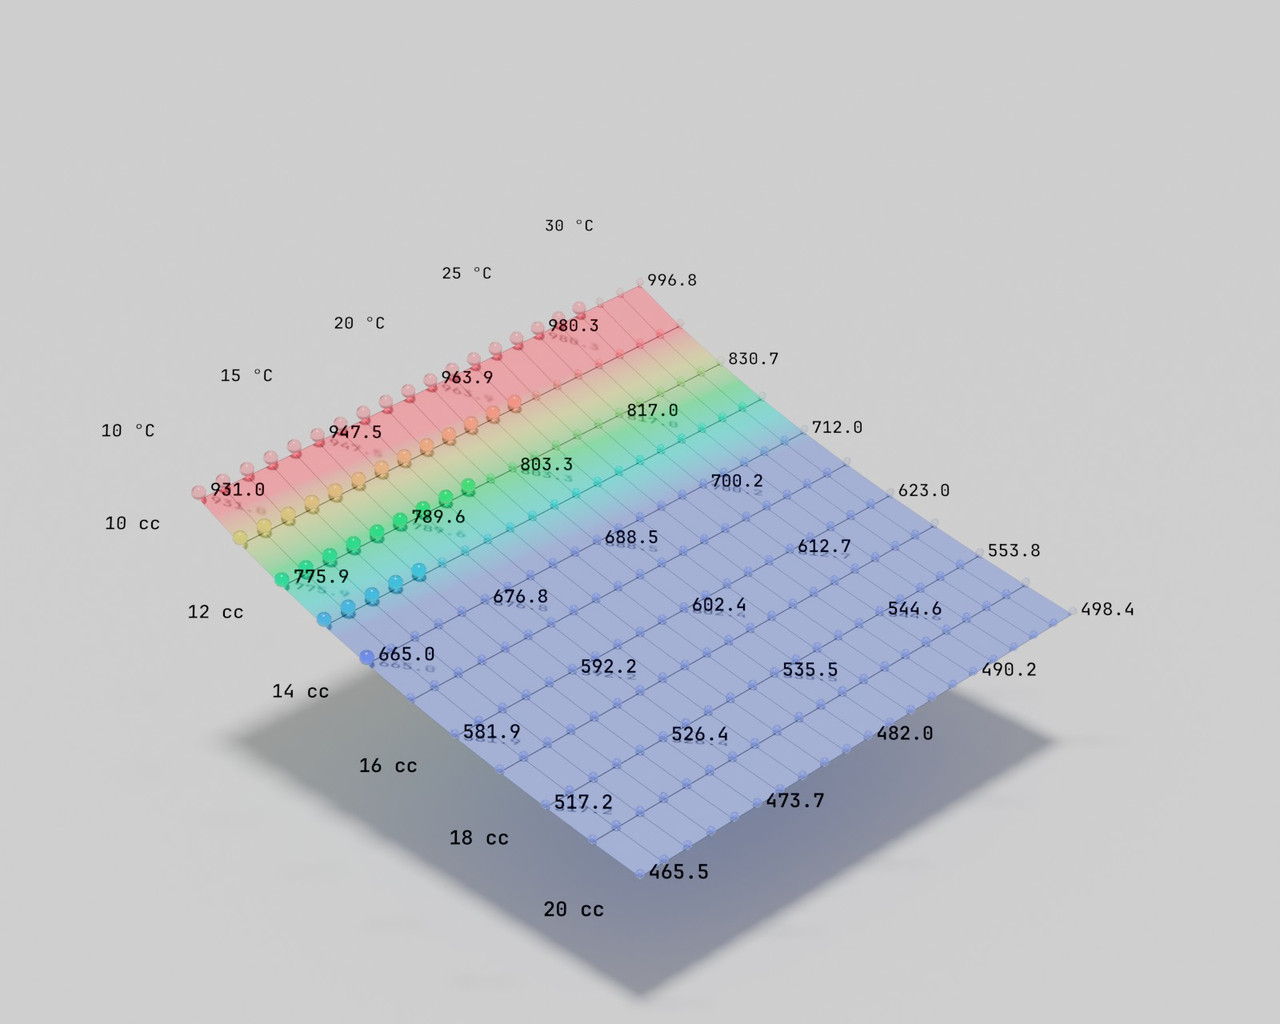
- Input CO2 cartridge size
- Set minimum volume with safe estimate cartridge dry volume
- Set maximum volume to account for expansion chamber
- Set temperature range I expect it to operate in
Result is pressure gradient plane (PSI) and its phase
small sphere = gas
large sphere = non-gas (liquid, supercritical fluid)
Color gradient for pressure regulator safe operation range